Reports
This material shows how the user can create dashboards, based on data obtained and registered on the MTC platform.
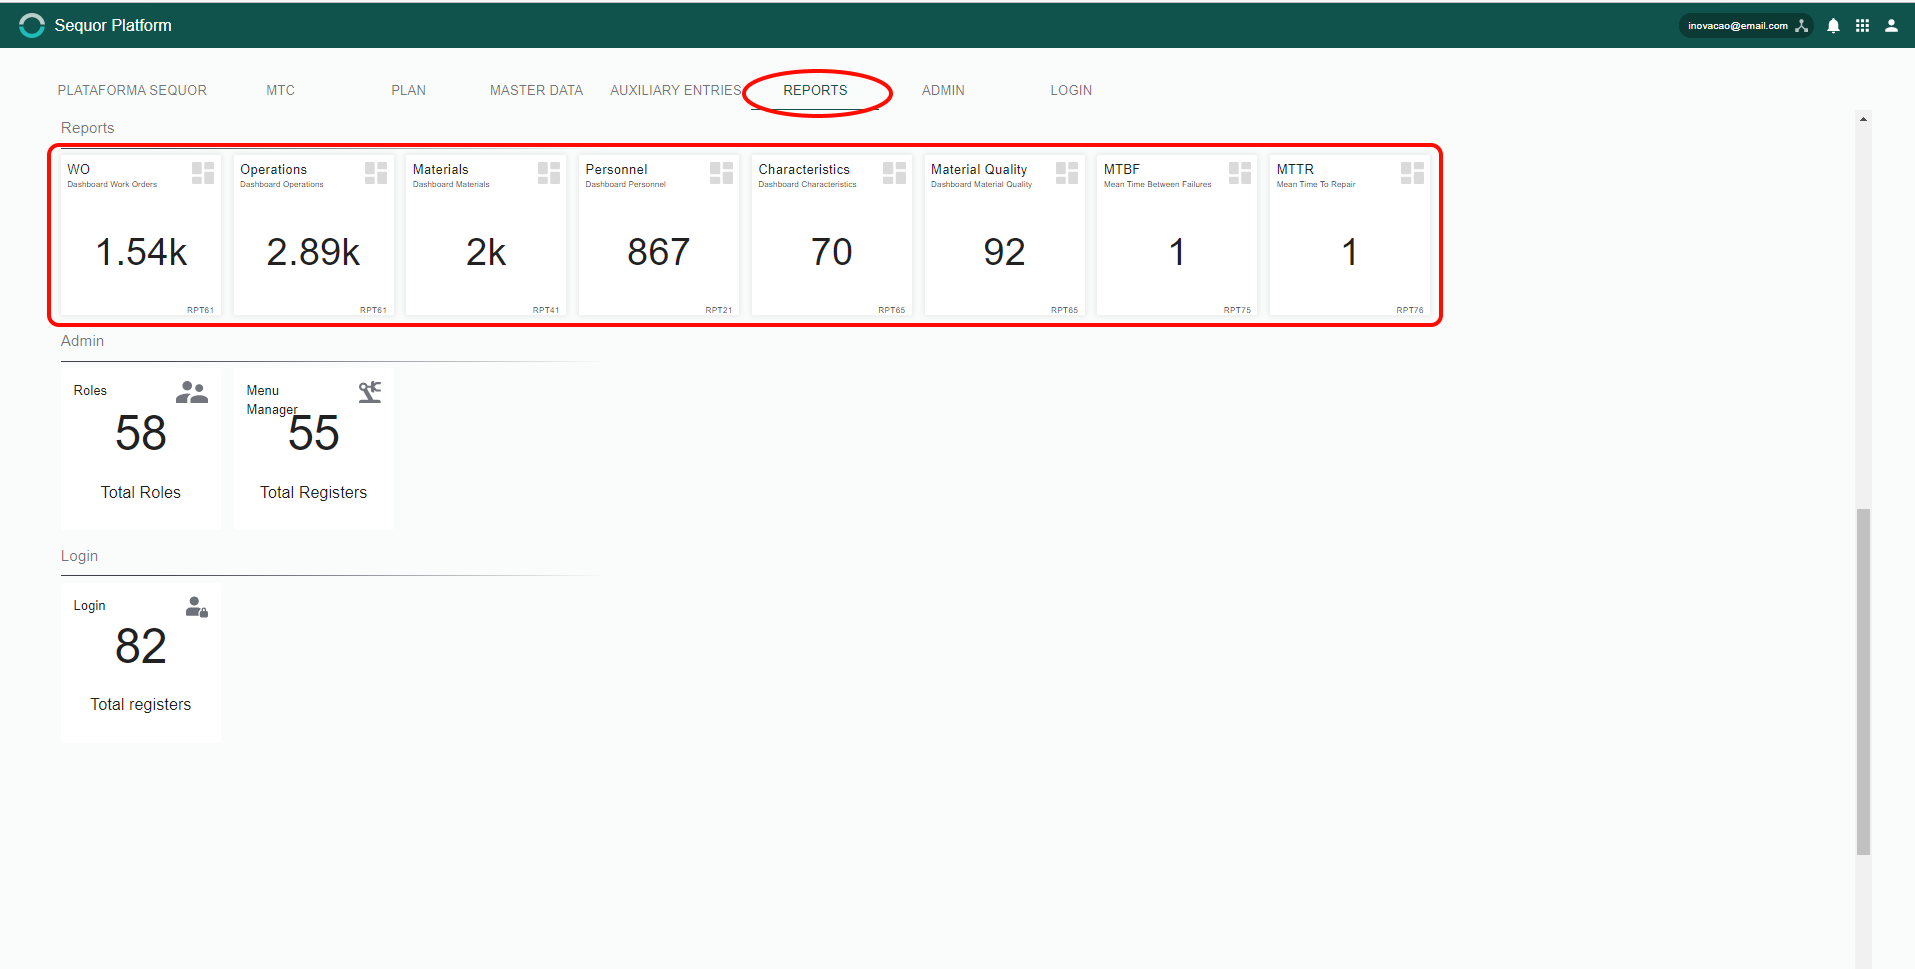
Create a Dashboard
Just choose which analysis field you want to analyze by clicking on the tiles.
When you click, this is the screen that will be appear:
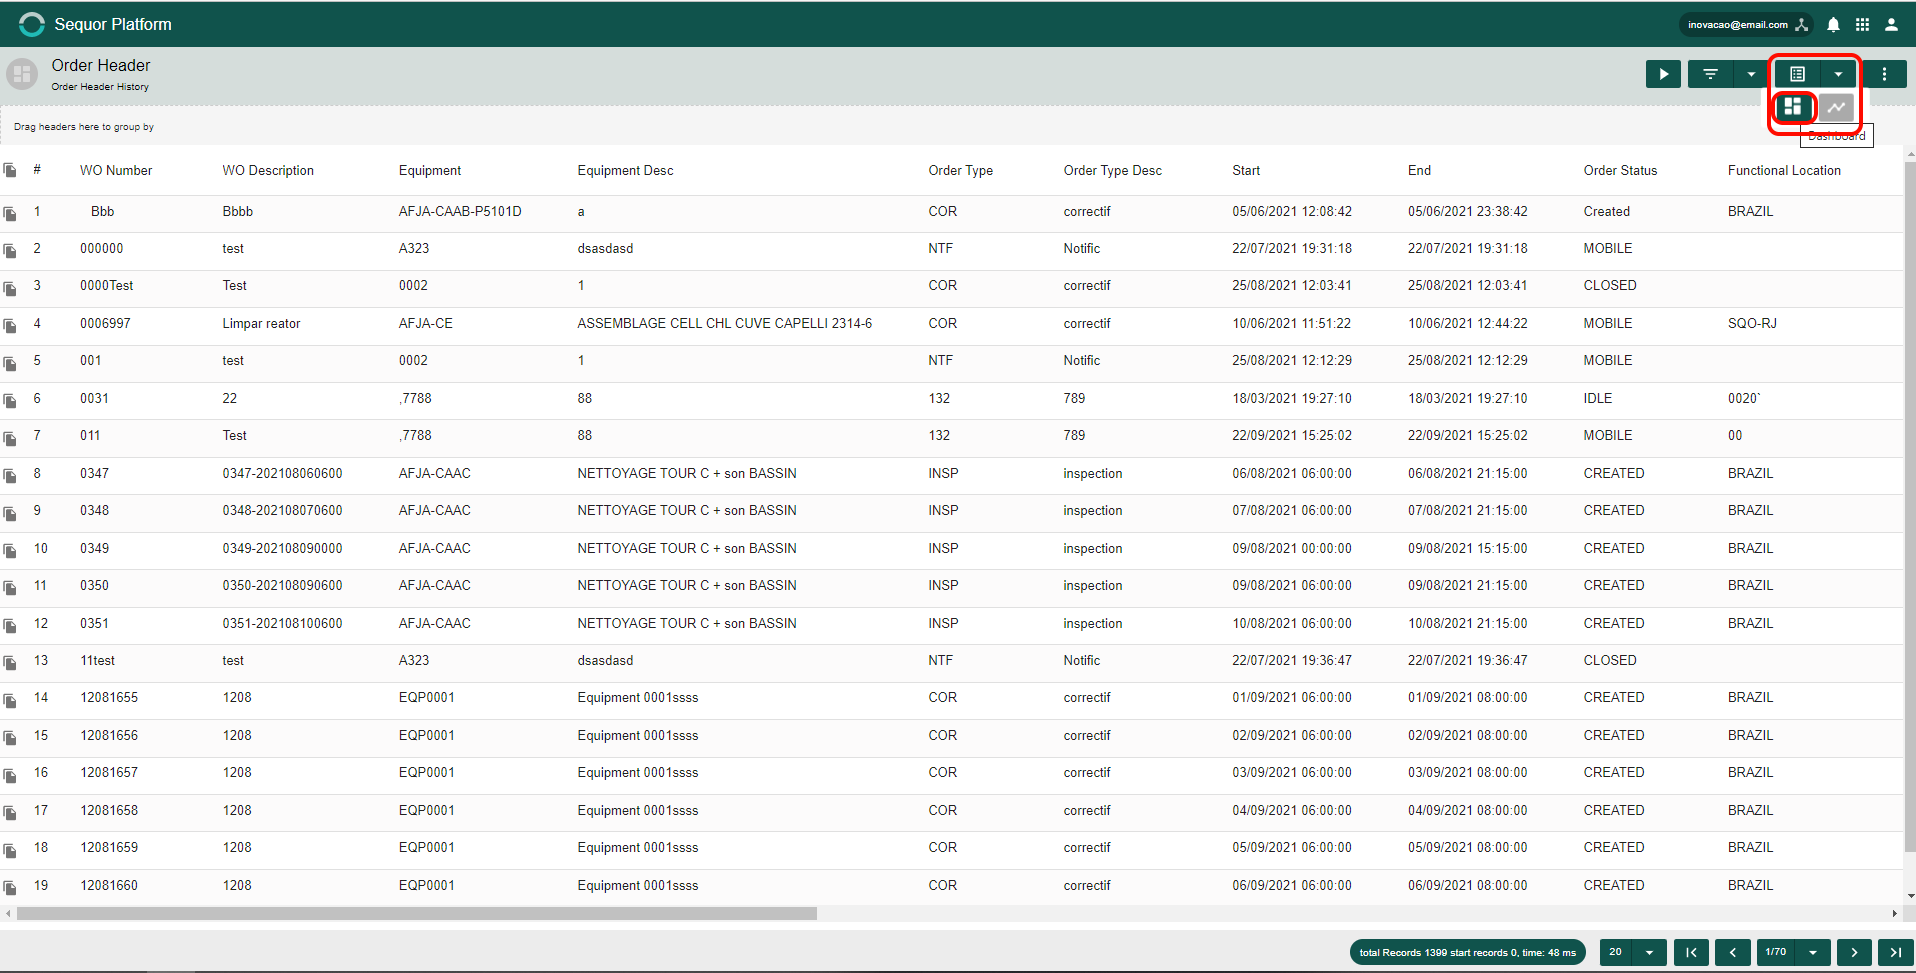
To access or edit a dashboard, just click ![]() and then
and then ![]() .
.
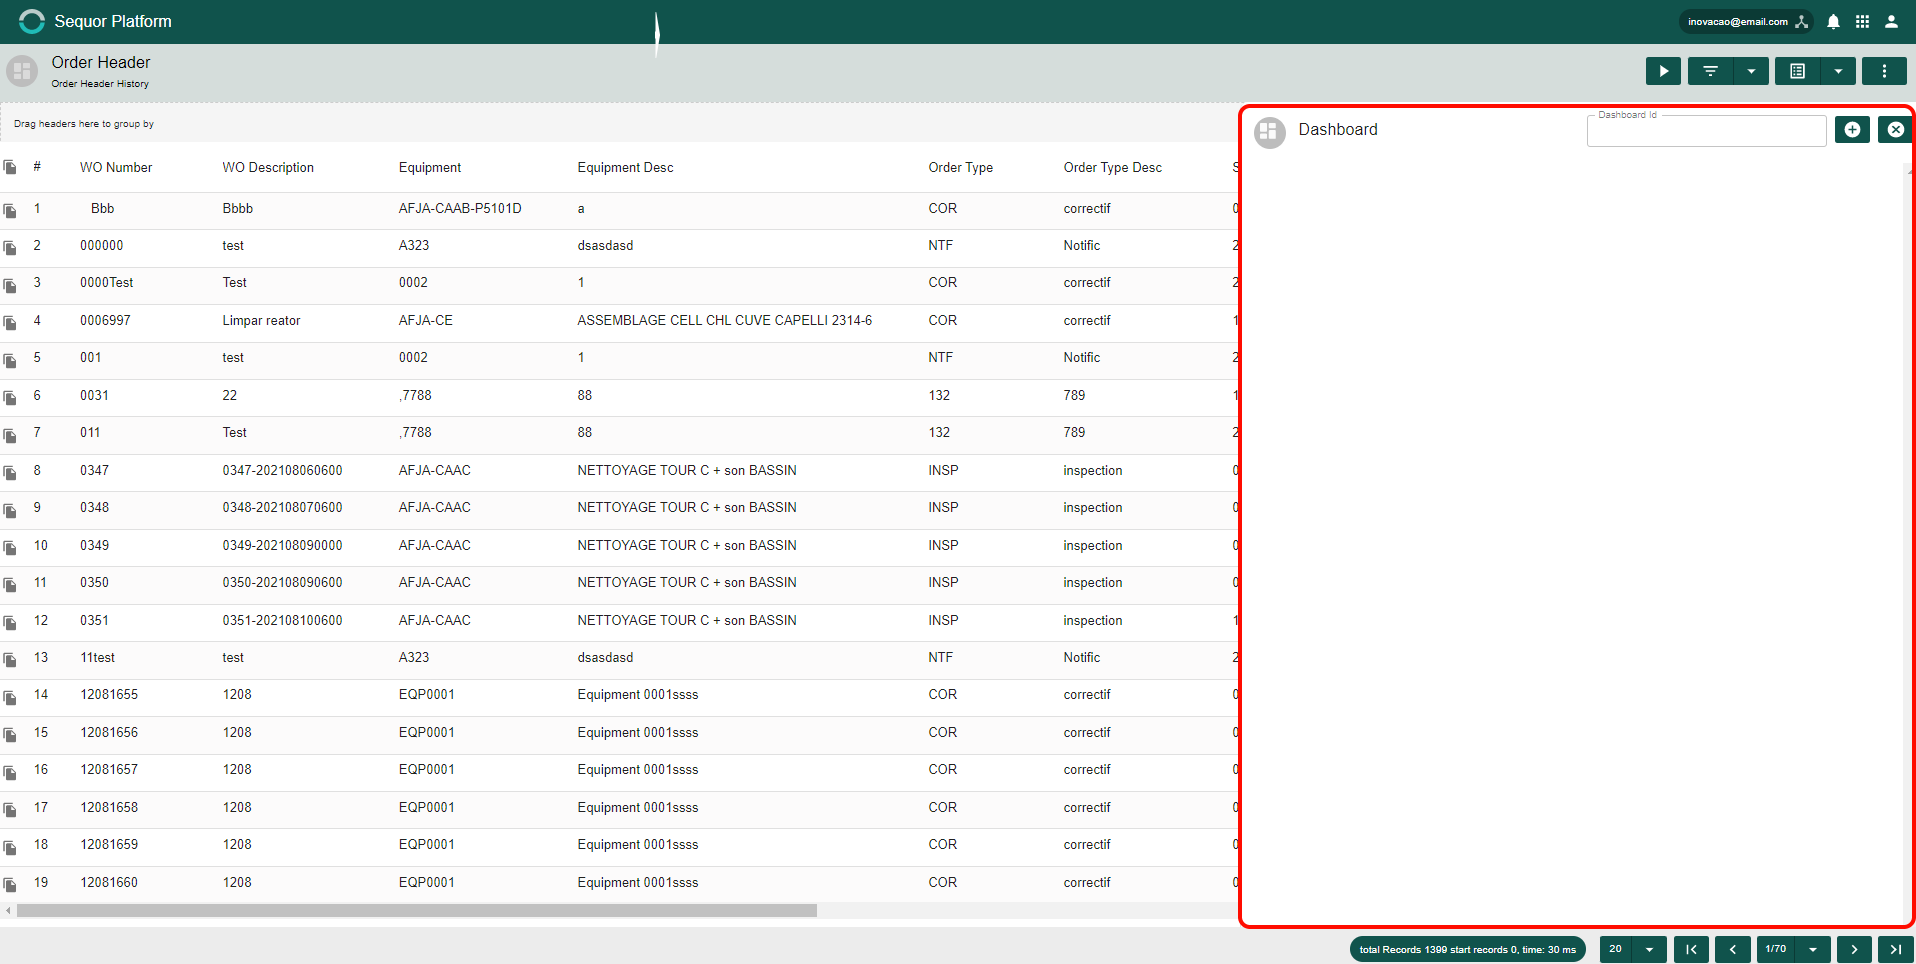
A box will open on the side where the dashboard will be created, enter the title and then click on the button ![]() .
.
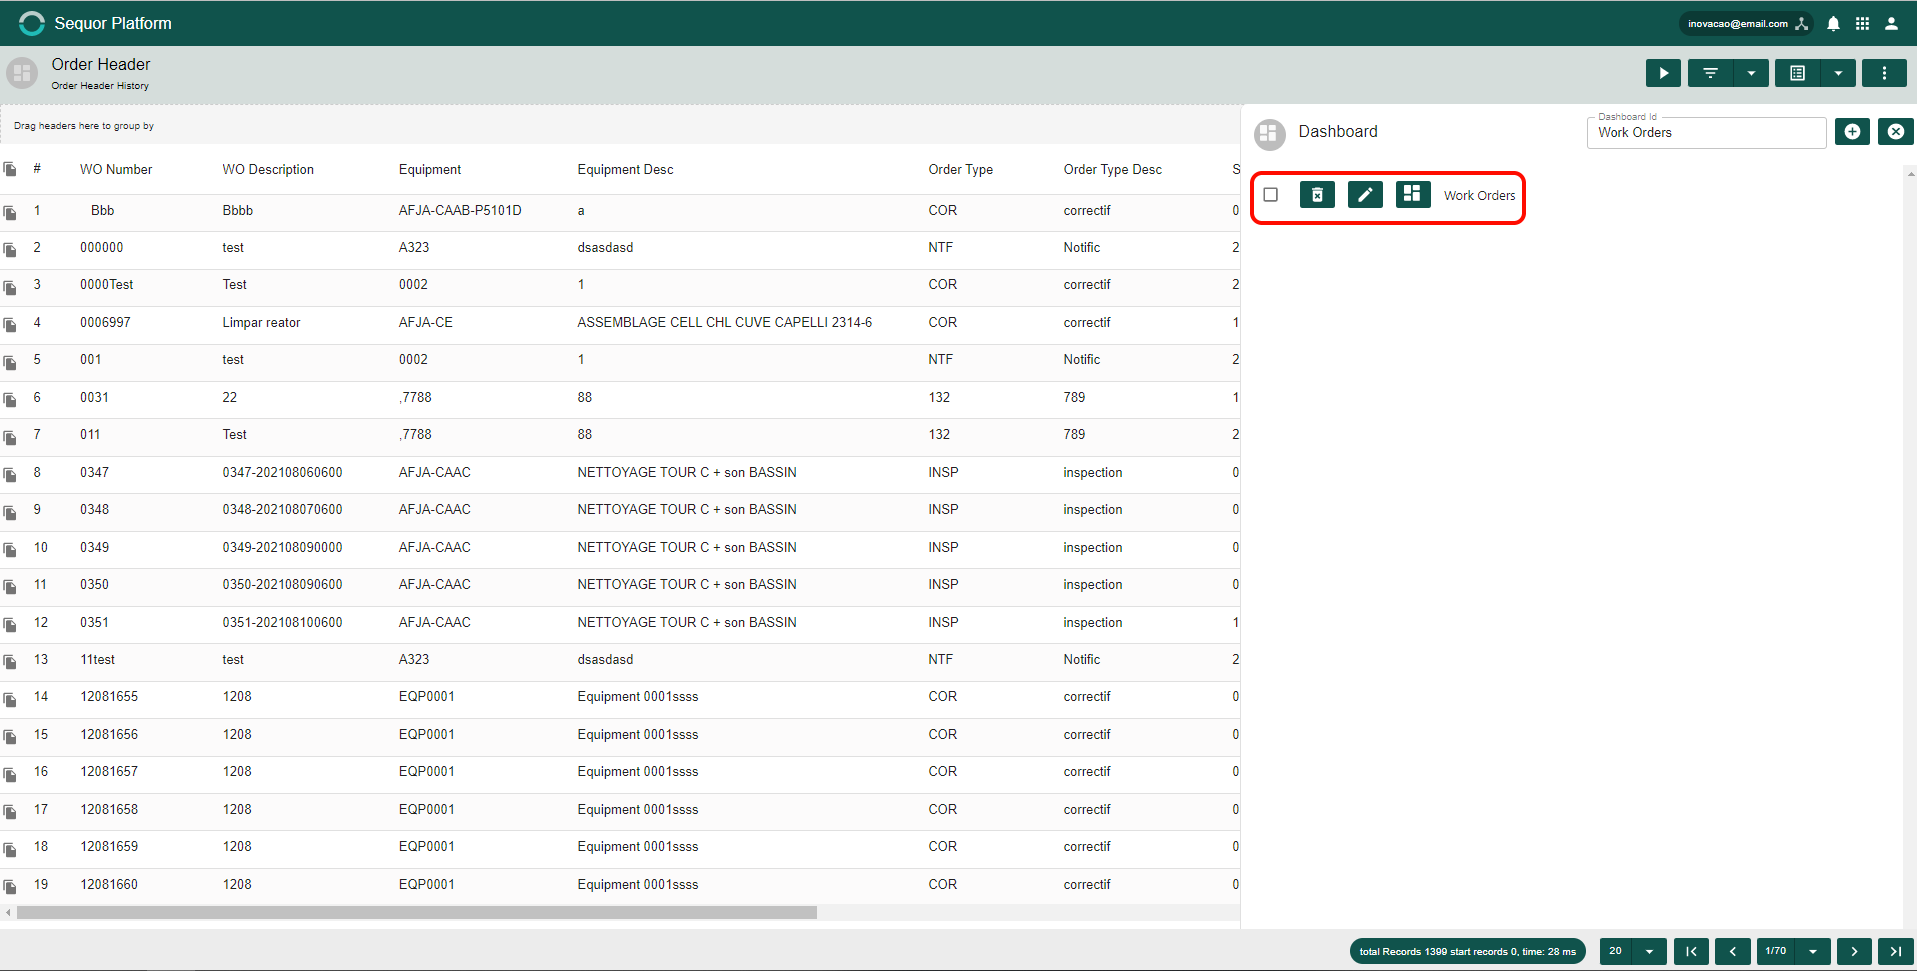
After this process, the name of the dashboard will automatically appear. By clicking on the check box, you will have the option to delete ![]()
![]() , edit
, edit ![]() and view
and view ![]() the dashboard.
the dashboard.
Creating Graphics (dashboard):
Click in ![]()
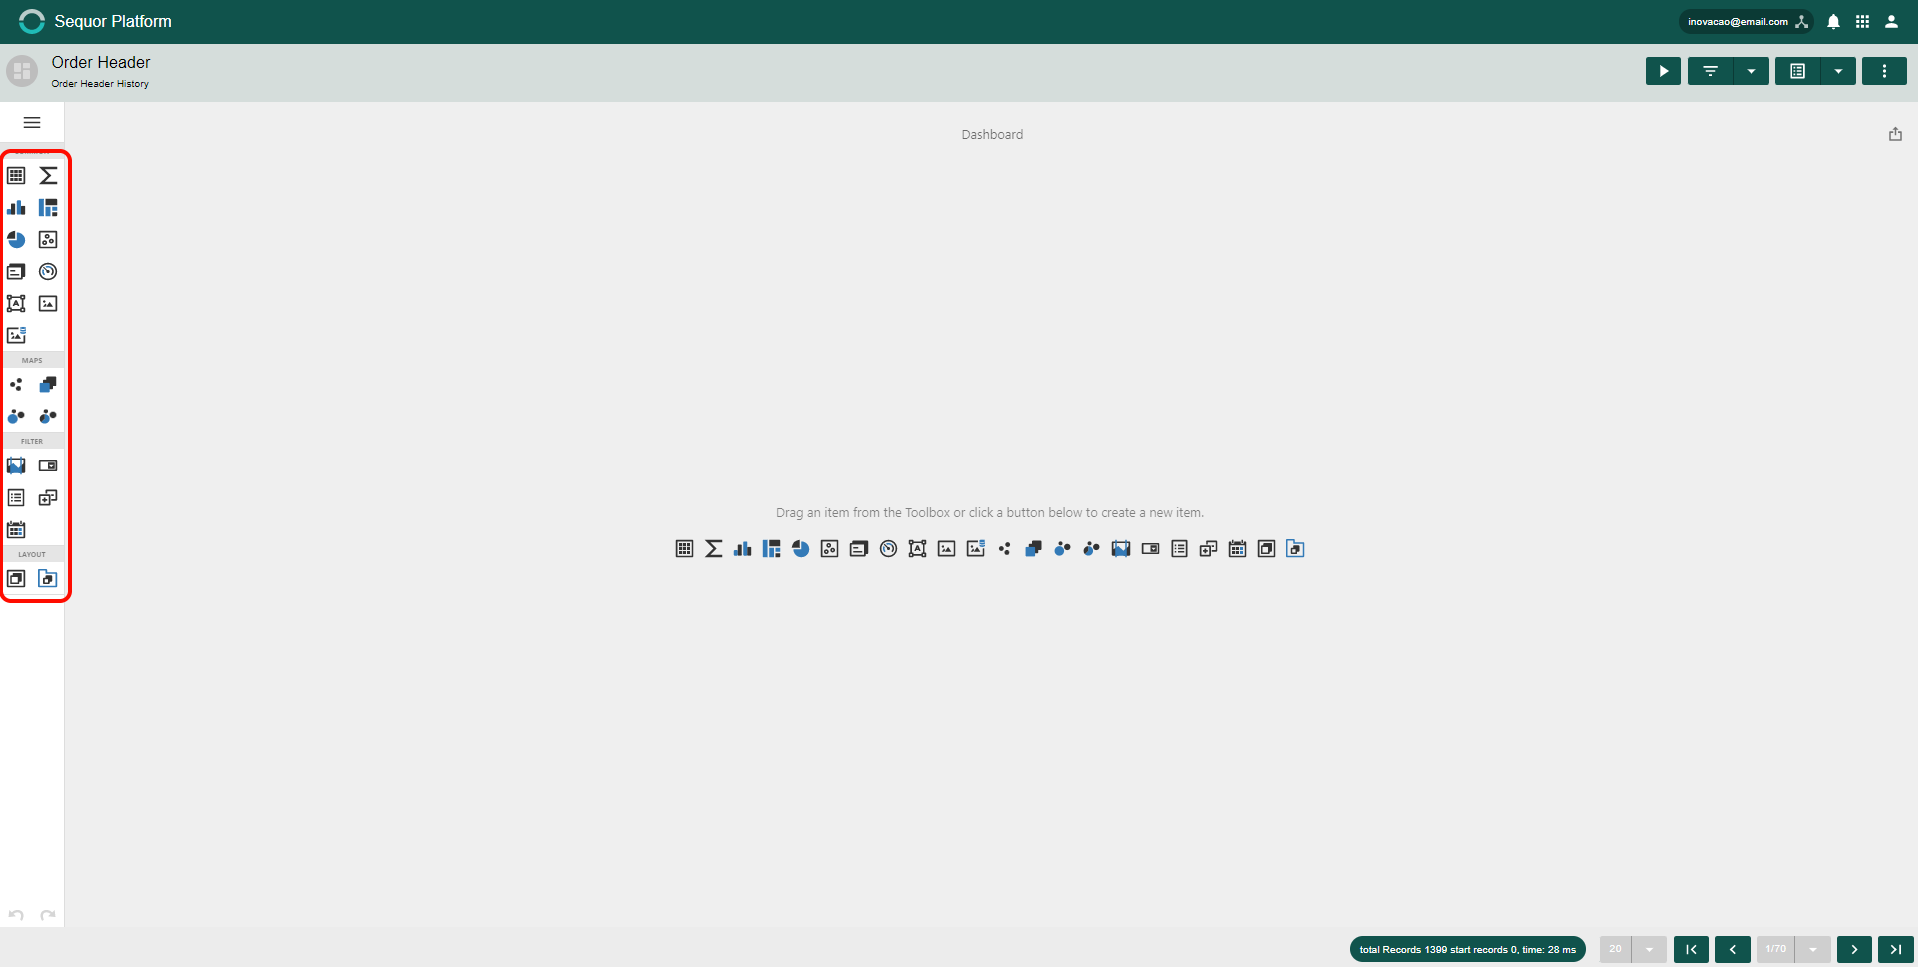
There are several options for creating charts and composing the dashboard. An example will be made to clarify further.
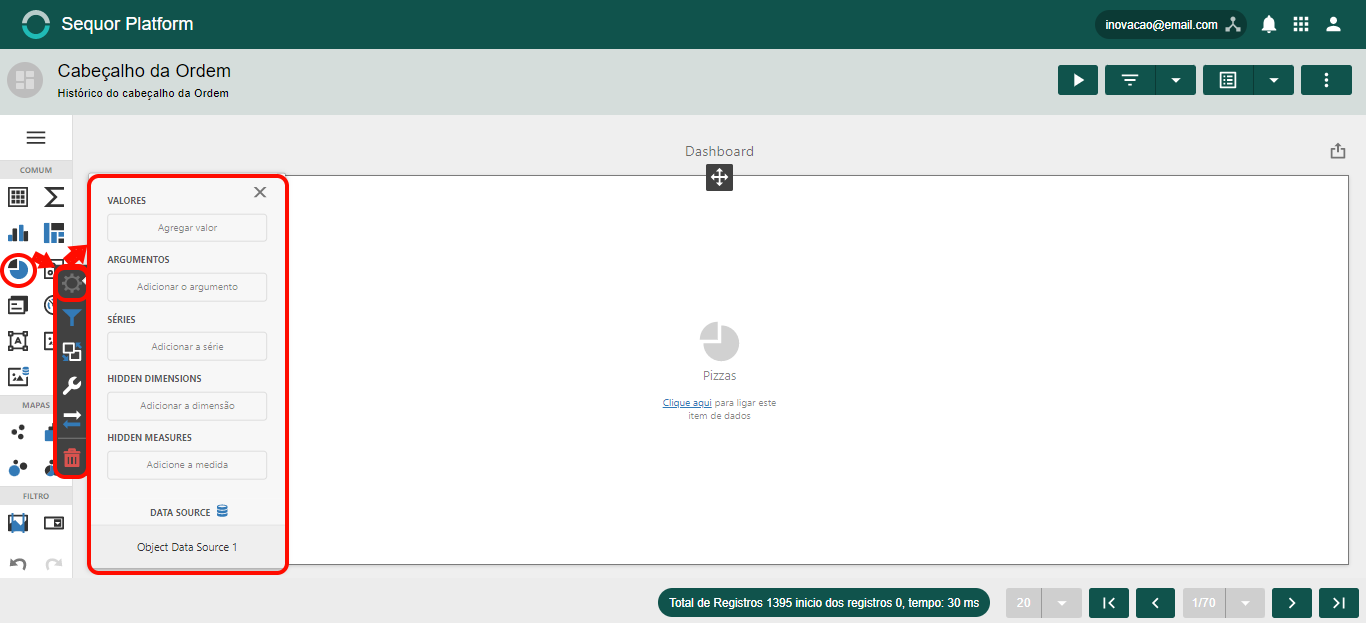
The example adopted is a "pizza" chart. Click on the button ![]() and then drag to the dashboard. Click on the button
and then drag to the dashboard. Click on the button ![]() . The options area will appear in order to create the chart as needed,
. The options area will appear in order to create the chart as needed, ![]() ,
, ![]() and
and ![]() .
.
The graphic will appear automatically. Create more than one chart in the dashboard composition.